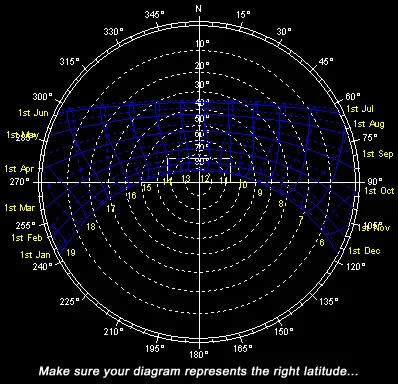
The solar altitude, and the solar azimuth, can be read directly for any date of the year and any hour of the day from the solar charts or sun path diagrams. There are several methods of projection for representing the sun”s apparent movement two dimesnsionally but the “stereographic” method described here is generally used.
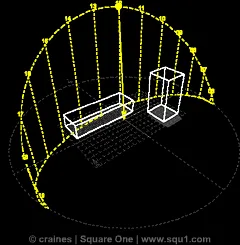
Consider any point on the Earth”s surface to be covered by an imaginary hemisphere. Any point on the surface of the hemisphere is connected to the sphere”s nadir – equivalent to viewing the inside surface of the upper hemisphere from the nadir as the eyes position. These connecting, or sight lines cut the equatorial plane of the sphere; this plane can represent the horizon. On this plane, at the intersection of sight lines, every point on the surface of the hemisphere can be projected. This yields a two dimensional projection, with the horizon forming the outer circle and the zenith the center of the hemisphere”s surface. On such a projection, the paths of the sun can be plotted, as they would appear to pass over the imaginary sky hemisphere; the altitudes can be represented by a series of concentric rings and the azimuths by a scale from 0° to 180° along the periphery. Hence, the altitude and azimuth of the sun at any date and time can be read off directly. Each such diagram will be correct for one Lattude; by reversal of the dating, each such diagram will also serve for the equivalent Latitude in the other hemisphere.
The sunpath diagrams also have hour lines plotted on them. All these times are in true solar time; that is the Sun is due south (in the northern hemisphere) at noon. It will be seen that the equinox sunpaths at all Latitudes show sunrise exactly due east and sunset due west, at 6:00 and 18:00 hours, respectively.
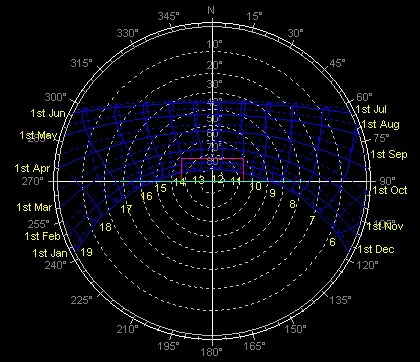
What is the method to read the altitude and azimuth angle from the sun path diagram ?
- Select the chart of the correct Latitude.
- Select the date line.
- Select the hour line and mark its intersection with the date line.
- Read off from the concentric circles the altitude angle.
- Lay a straight edge from the center of the chart through the marked time point to the perimeter scale and read off the azimuth angle.