The Residential Design Codes of Western Australia” requires buildings to be design for climate. Protecting solar access for neighbouring properties is an important design criteria. Excessive shadows should not be cast onto adjacent properties. Building Surveyors should be familiar with general requirements for climatic design.
Solar Altitude and Azimuth Angles
The Sun’s position in the sky is defined by two angles. The Solar Altitude angle is the vertical angle up from the horizon. The Azimuth is the horizontal rotation angle from Due North (in the Southern Hemisphere) or from Due South (in the Northern Hemisphere).
A more precise calculation of overshadowing for particular month and times of the day can be determined from suncharts. (The sunchart is a map of the sun’s path across the sky during the year and maps out the sun’s position as a function of day and time.) There are two types of suncharts:
| a) Cylindrical sunchart Figure 2 | b) Polar sunchart 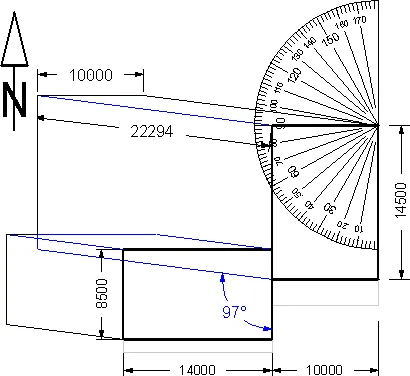 Figure 3 |
Figure 1 & 2 show two typical suncharts for Perth 31.97° south latitude. These suncharts map out the sun’s position in the sky (vertical and horizontal shadow angles). For the location of the sun’s position you need two coordinates, the altitude VSA (Vertical Sun Angle) and the azimuth HSA (Horizontal Sun Angle). The altitude angle (angle of elevation) measures the sun’s location in the sky above the horizon.
Figure 1 (cylindrical sunchart) shows the azimuth angle in degrees east or west of due North (southern hemisphere). Angles being positive due east (sunrise) and negative due west (sunset).
Figure 2 (polar sunchart) shows the azimuth as compass bearing, relative to direction north. Azimuth angles range from 0 degrees (north) through 90 (east), 180 (south), 270 (west), and up to 360 (north again).
The cylindrical sunchart seems to be easier to use. The University of Oregon has a program that creates cylindrical suncharts for any location on the earth. Use these suncharts to determine the altitude and azimuth angle for your assignment. Remember for Australian locations south latitude input in negative degrees and east longitude input in positive degrees, and the time zone for WA is UTC + 8 h.
The figure below shows the steps that are required to create the sunchart.
 Step 1 and 2 are the minimum input to create a chart. Step 3 select Plot only this date to depict one curveonlyStep 4 change Extend azimuth to crop azimuth andyou may selection other to suit your own styleStep 5 in Line 1 type the City that your group coversin Line 2 type your name otherwise leave it blankStep 6 leave the default setting Step 7 create chart and print it. | 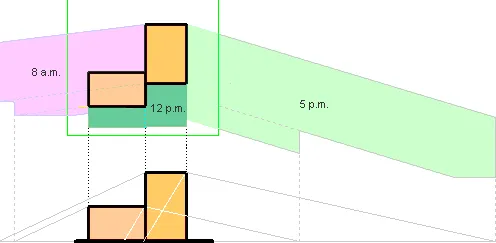 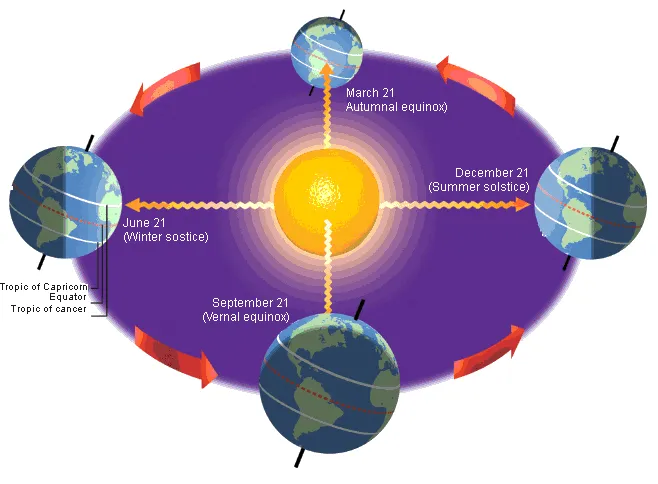 |
Templates for Assignment 1 will be provided to record the appropriate data (see Table 1 including longitude and latitude angles for various WA locations) it also provides site plan and building elevation to draw the required shadows.
Table 1
| Shade Angles | |||||||
| Location | Month | 8 a.m. | 12 p.m. | 5 p.m. | |||
| Altitude | Azimuth | Altitude | Azimuth | Altitude | Azimuth | ||
| Perth | December | 37.0° | 97° | 81.5° | 0° (360°) | 24° | 253.5° |
| Jan/Nov | 35.5° | 92° | 78° | 0° (360°) | 22.5° | 260° | |
| Latitude 31.9667°S | Feb/Oct | 31.0° | 83° | 69° | 0° (360°) | 18° | 268° |
| Mar/Sept | 25.0° | 68° | 58° | 0° (360°) | 12.5° | 278° | |
| Longitude 115.8167°E | Apr/Aug | 18.0° | 63° | 46° | 0° (360°) | 6° | 288° |
| May/July | 12.5° | 57° | 37.5° | 0° (360°) | 1.5° | 295.5° | |
| June | 10.0° | 53° | 34.5° | 0° (360°) | 0° | 298° | |
Example of how to draw a shadow cast from a building
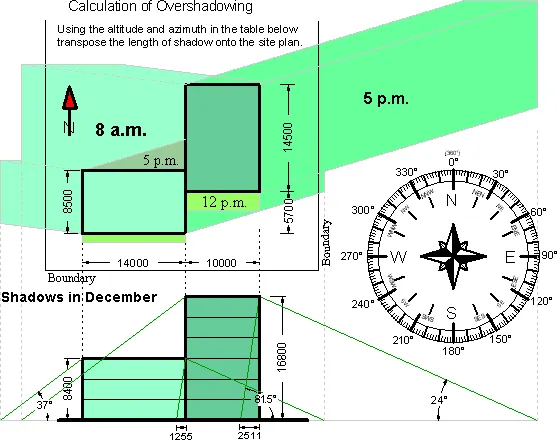
A site plan should be drawn to scale, showing the proposed building, the property lines, and a north arrow. With the help of the sunchart find altitude & azimuth angles. Table 1 above list shade angles for 8 am, 12 pm & 5 pm for the year, location Perth. Assignment 1 will give you an understanding of the shortening and lengthening of a shadow by tracking one throughout the day.
Altitude angle
The altitude angle is used to find the length of the shadow that the building cast onto the ground. Let the height of the building be 16.800 m and the altitude angle 37° (8 a.m. December, see Table 1). The length of the shadow can now be calculated 16.8 / tan 37° = 22.294 m (level ground).
(You could use the graphical method (shown in Figure 5) and draw the shade angle from top of the building until it hits the ground level. The point where the shadow line hits the ground could then projected onto the site plan. However, this method is an approximation and only accurate if the sun rays would come from due east or due west, but the real shadow angle must be measured in the direction of the azimuth angle)
The distance should therefore be calculated and measured along the direction of the azimuth angle.
For all azimuth angles a sun chart must be used to establish the direction of the shadow lines. In the cylindrical sunchart the azimuth angles are given in positive degrees east and negative degrees west.
Figure 4
Azimuth angle
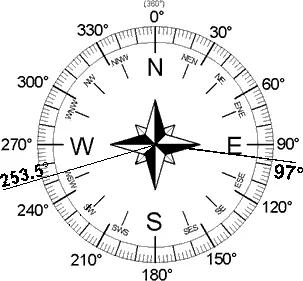
In December the azimuth angle is 97° at 8 a.m. and 253.5° at 5 p.m. (Table 1). An azimuth bearing uses all 360° of a compass to indicate direction as shown in Figure 6.
The 253.5 figure is derived by subtracting 106.5° (sun chart figure) from 360°.
Figure 5
There are a number of computer programs that calculates altitude and azimuth. If you want to know the Sun Altitude/Azimuth angles for a specific location use the U.S. Naval Observatory Specify year, type of table, and place (scroll down to B)
Form B – Locations Worldwide.
Example how to measure the azimuth angle
Place the protector on the corner of the building and mark the 97°
The length of the shadow is 22.294 metre as previously calculated.
The sunchart angle is positive (east) or negative (west) and the shadow length can be easily calculated using
S = building height / tan ![]()
![]() = altitude angle
= altitude angle
Figure 6
(The negative sign is of no relevance for the shadow length calculation.)
The data for the month December at 8 a.m., 12 p.m. and 5 p.m. are used in Figure 5 to draw a shadow diagram graphically. Please remember that this method is only accurate if the azimuth angle is exactly 90° east or -90° west (270° compass bearing). If the azimuth angle is not greater than 107° (error in this case is less than 5%) then the graphical method can be used otherwise the calculation method must be used for the Assignment 1
Figure 7
Figure 8
Figure 9 shows the shadows in March and September (Equinox days). High building will cast long shadows. (Azimuth and altitude angles are taken fromTable 1.) The shadows changing during the day times and the seasons. Seasons are periods in a year marked by specific weather conditions, temperatures and length of day. A year is divided in 4 seasons: spring, summer, autumn and winter.
The earth seasons
A season is a period of the year that is distinguished by special climate conditions. The four seasons spring, summer, autumn (fall) and winter follow one another regularly. We use the dates of equinoxes and solstices to mark the beginning and end of seasons in a year. These seasons are differ in north and south hemnisphere.
There are 4 astronomical seasons in a year:
►spring – March Equinox to June Solstice,
►summer – June Solstice to September Equinox,
►autumn – September Equinox to December Solstice, and
►winter – December Solstice to March Equinox.
Figure 9
The equator divides the earth in two parts. The two parts are named as Northern Hemisphere (the part north of the equator) & Southern Hemisphere (the part south of the equator). Seasons are different the hemispheres. Spring in the northern part is Automn in the southern part, and Summer is Winter respectivly
For half the year the Northern Hemisphere is inclined toward the Sun while for the other half year the Southern Hemisphere has this distinction. The two moments when the inclination of Earth’s rotational axis has maximum effect are the solstices.