In an isometric projection, the x-, y- and z-axes have the same metric: a unit (say, a centimetre) along the x-axis is equally long along the y- and z-axes. In other words, if you render a wire frame cube, all edges in the 2-dimensional picture are equally long. Another property of the isometric projection is that the projected wire frame cube is also symmetric. All sides of the projected cube are rhombuses.
NEN 2536 describes an isometric projection that is symmetric with regards to the vertical axis; the angle between the x- and y-axes, and between the z- and y-axes, is 60 degrees. The projection shows three sides of a cube, and the surfaces of each side are equal. The 30° angle between the x- and z-axes and the “horizon” is convenient for technical drawings, because the sine of 30° is ½. This projection is attributed to William Farish who published a treatise about it in 1822 (reference: Jan Krikke). NEN 2536 has been revised and republished as the international standard ISO 5456-3.
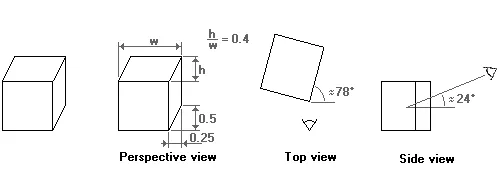
The figure below shows a cube in the isometric projection as defined by ISO 5456-3.The first object from the left in the figure is the cube unadorned; the second object is the same cube with angles and measures annotated around it. The third and fourth graphics are the top and side views of the perspective scene and they give the camera position that fits the perspective view. The camera position is what you would feed into a 3D renderer (or ray tracer) to create the sprites or tiles for the isometric projection.

The 30° isometric projection (NEN/ISO)
Computer games with isometric maps are often tile-based. To make tiles match, the game designer must take into account how diagonal lines are plotted in discrete steps (Bresenham and all that). As it turns out, a line at 30 degrees (sine is 0.5) produces steps that are too irregular. A line at an angle where the tangent is 0.5 does have a nice regular pattern: two steps to the right, one step up. Thus, the isometric projection used by most games tilt the x- and z-axes with approximately 27 degrees (the exact angle is “arctangent(0.5)”). By the way, because the tangent of the angle of the rhombus is 0.5, the rhombus is twice as wide as it is high. This is why many sources mention a 1:2 scale for isometric perspectives. (To make the edges of the rhombuses match, the width of the rhombus should be a multiple of four pixels and the height should be one pixel less than ½ width. In other words, the height:width ratio of a rhombus is usually not exactly 1:2, but rather near 1:2.1. This makes no difference for the principles of the isometric perspective.)
Again, the figure below shows what this isometric projection looks like.

The 1:2 isometric projection
The two isometric projections mentioned above “skew” all faces of the example cube. In applications where the most important faces are the horizontal ones, for example in applications where maps or floor plans are paramount, another isometric projection is common. It is called the “military” projection, probably because of its origin or use.

The “military” projection
In the military projection, the angles of the x- and z-axes are at 45°, meaning that the angle between the x-axis and the z-axis is 90°. That is, the x-z plane is not skewed. It is rotated over 45°, though.
In the side view of the military projection (the graph at the right), I have indicated that the viewing angle downwards onto the object (the cube) is approximately 45°. The military projection gives a quite inaccurate perspective —numerically speaking, and the scheme that I used to calculate the angles does not work on this projection. This angle is therefore just an estimate, based on a concept of symmetry rather than visual accuracy.
The dimetric projection
In the dimetric projection, one of the three axes has a different scale than the other two. In practice, the scaled axis is the z-axis and, hence, a cube drawn in a dimetric projection is not a symmetrical graphic (like in the isometric projection).
Dimetric projections are more flexible than the isometric projections, as you vary the scale factor (and adjust other parameters in accordance). The asymmetry in the dimetric projection also provides you with an additional angle to play with. From an artistic viewpoint, I also like dimetric projections better than isometric projections, because of the asymmetry. Or rather, the symmetry of an isometric projection makes the scene look “artificial” or surrealistic. Another advantage is, in a computer game, that if you mirror the graphics of a dimetric projection, you are looking at a scene in a new, “fresh“, perspective, while the basic computations for the coordinate system stay the same.
NEN 2536 also presents a dimetric projection for technical drawings. It is summarized in the figure below. Any distance along the z-axis (drawn at 42°) is scaled at a factor ½.

The 42°/7° projection (NEN/ISO)
The introduction mentioned Chinese scroll paintings, and I took some time taking the metrics of (reproductions of) two scroll paintings. The projection is different in these two paintings, and I assume that more variations exist. Noticeable in all scroll paintings that I have seen so far, is that the x-axis stays horizontal.
The first scroll painting projects the z-axis to quite a low angle (approximately 30 degrees). As a result, the perspective view is, computationally, far from accurate. The reasons that we still see a 3-dimensional cube, rather than some kind of flat polygon, is that the angle in the “side view” of the perspective view is also low and because our visual system is quite forgiving for errors in perspective correction.
The scale of the z-axis could not be accurately determined from the scroll painting. My estimate is that the z-axis on the painting (with a 30° projected z-axis) is scaled by half (50%).

The “Chinese perspective”
Also note (again) that the perspective is distorted and that the angles of the top view and the side view should be taken as a “rule of thumb”; I calculated these angles in the same way as the angles in the dimetric projection presented in NEN 2536/ISO 5456-3, but these calculations are, actually, no longer applicable.
The other painting, reproduced below, has the projected z-axis at a bit less than 40 degrees, but slanted in the other direction. On the one hand, I could say that the z-axis is slanted to approximately 130° (90° + 40°), but on the other hand the the direction of the slant is insignificant for the discussion of axonometric projection.

A reproduction from an 18th century remake of an 11-meter handscroll by artists of the Qing court, published in “A City of Cathay”
I can give only a rough estimate of the scaling of the z-axis in this scroll painting (“a City of Cathay”): between 0.6 and 0.7 (but probably closer to 0.6).
Dimetric projections for computer graphics and games
As was the case with the isometric projection, in computer graphics some angles are preferable to others. The first dimetric projection that I propose for (tiled) computer graphics is very similar to the projection of Chinese scroll paintings. The difference is the scale of the z-axis, and the angle that it makes with the x-axis. To start with the angle, the z-axis is slanted with approximately 27 degrees (the exact angle is “arctangent(0.5)”). This is the same angle as the isometric projection for computer graphics uses. The scale is such that the width of the side view of a cube, when measured along the x-axis, is half of the width of the front face. The key phrase in the previous sentence is “when measured along the x-axis”. In the two former projections, the scale factor applied to distances measured along the z-axis.

Dimetric 1:2 projection “side-view”
The above projection gives a perspective that is viewed mostly from the side. I might be useful to add some depth to a side-scrolling (or “platform”) game. For board-like games, a perspective that is viewed from a greater height is more appropriate. The second proposed dimetric projection for games serves this end.

Dimetric 1:2 projection “top-view”
Again, note that the perspective of the two projections suggested above is distorted. The angles in the top and side views are really approximate. For example, in the second projection the angle at which one looks from above at the scene is given as 24 degrees. However, using an angle of 30 degrees may actually look better. In addition, a 30-degree angle lets you use the same objects for both the dimetric and the isometric projections for games.
Other dimetric projections are summarized in the table below. These projections were taken from the CARTESIO program. For each projection, I give the name that the program gives to the projection, the slant for the x- and z-axes and the scale for the z-axis. In all the projections presented here, the the y-axis remains vertical and the x- and y-axes have the same scale.
| projection name | x-axis angle | z-axis angle | z-axis scale |
| 130, 130, 100 | 10 | 40 | 0.59 |
| 1, 1, 2/3 | 12.8 | 38.6 | 0.667 |
| 1, 1, 3/4 | 16.3 | 36.8 | 0.75 |
The CARTESIO program lists more projections than the few above, including those of the NEN 2536/ISO 5456-3 standards and a few ones that are so distorted that I see no practical use for them.
Moving across an axonometric projection

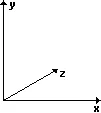
Converting from space coordinates (x,y,z) to a pixel coordinate (x’,y’) in the projection requires only trivial geometry. The table below presents the formulae for completeness. Please refer to the coordinate system in the figure at the right for my definition of the x-, y- and z-axes; in 3D space, the y-axis points upwards and the plane is defined by the x- and z-axes.


Note that in the above equations, the various sines and cosines are constant for a given projection and they need to be calculated only once.
Converting coordinates in the projection to space coordinates is a different matter. In its general form, it simply cannot be done: you cannot calculate three independent output parameters from two input parameters. If you can “fix” one of the output parameters, the other two can be calculated from the input parameters. An example: if the axonometric projection represents a map and you can assume that the area on the map has little or no relief, then you can fix the position on the y-axis to zero (ground level), and you only have to calculate x and z from x’ and y’. (Again, note that in the three-dimensional coordinate system that I am using, the y-axis points upwards.)


The denominators of all fractions and many of other the factors in the above equations are constant, and need to be calculated only once. For example, the complex looking denominator cos2(7∘)⋅sin(42∘)+cos(7∘)⋅cos(42∘)cos2(7∘)⋅sin(42∘)+cos(7∘)⋅cos(42∘) in one the fractions for the NEN 2536 projection is a constant with the (approximate) value of 1.397.
A refinement of the above is to support some amount of relief. The calculation of the output coordinates starts as before, only now the y-coordinate is an estimate, rather than a “known” value. After calculating the x- and z-coordinates, you can look up the corresponding “height” value at the position (x,z). Typically, they will not match with the y-coordinate that you guessed when calculating the x- and z-coordinates. Now you can adjust you estimate of the y-coordinate and calculate the matching x- and z-coordinates again. This iteration continues until the estimated y-coordinate (before calculating x and z) comes close enough to the looked-up value (after calculating x and z).
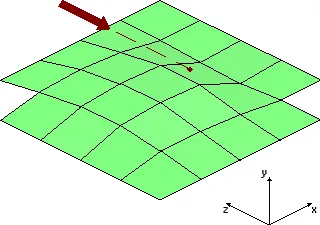
The principal question in following this iterative procedure is: “does it converge?” Following intuition, the procedure is considered to converge if no spot on the project surface obscures another location in 3D space. That is, if the slopes of the surface relief stays below the viewing angle (in the “view direction”), every location on the map in 3D space has a unique “sibling” location in the axonometric projection, which is visible from the view point.

In the above image, the viewing angle from the horizontal plane is 30 degrees and the steepest slope in the view direction is approximately half of that. The figures with the wire-frame cubes in this article show the angle at which you look on the plane (for the NEN 2536 isometric projection, it is 35° and for the 1:2 projection used in most isometric games, it is 30°). If the slopes in your board stay below this limit, the iterative procedure of calculating x and z given y and then adjusting y, until y does not change any more, will converge.
If you have extreme relief, or overlapping “ground levels” such as bridges or buildings, I suggest that you separate the projected map into parts that, themselves, adhere to the limitation of no steeper angles than the viewing angle. These parts can be separate “layers” or “sprites” and you build the full map by combining them. To calculate (x,y,z) from (x’,y’) you first decide on what layer/sprite the location (x’,y’) is and then use the iterative procedure to find the values of x, y and z.


Comments are closed.